 Throughout the past four weeks, we’ve posted about the wonderful initiatives that SUNY has set in motion throughout 2012. From Launching the Smart Track Campaign to Forming the Chancellor’s Online Education Advisory Group to saving millions in Shared Services‘ first year of operation, SUNY is truly setting an example of not only higher education functionality and value, but sets an example of effectiveness and efficiency in its position as the nation’s largest higher education system.
Given these many programs and initiatives resulting from challenging goals set forth, SUNY is faced with the task of self-checking its progress and outcomes. In 2011, Chancellor Zimpher launched the SUNY Report Card designed to do just that.
The Report Card is an honest evaluation of SUNY’s performance in the past year. It highlights initiatives that were met and, more importantly, highlights goals that may not have been fully achieved. The latter provides a vehicle for urgency so that the University System may continue to move forward in both an operational and mission-focused sense.
The SUNY Report Card is one of the most explicit forms of transparency present in any public institution. It provides solid figures and statistics for SUNY and its stakeholders, such as student enrollment, SUNY’s impact on the state and local economy, students’ financial aid, and more.
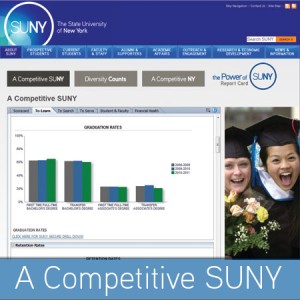
This past year, SUNY was proud to announce that the SUNY Report Card, beginning in 2012, would be made available online.The new medium allows viewers to get a more in-depth quantitative analysis and completely control their own exploration through SUNY’s various interest points that are reported.
The Report Card is divided into three sections: A Competitive SUNY, Diversity Counts, and A Competitive New York. The 2012 SUNY Report Card is presented in two ways since being made available online. A Competitive SUNY is an interactive online tool. Diversity Counts and A Competitive New York are PDF documents that have a similar look and feel as the new online tool.


